
- Start >
- Rivers >
- Waterlevel >
- Obere Donau >
- Aha >
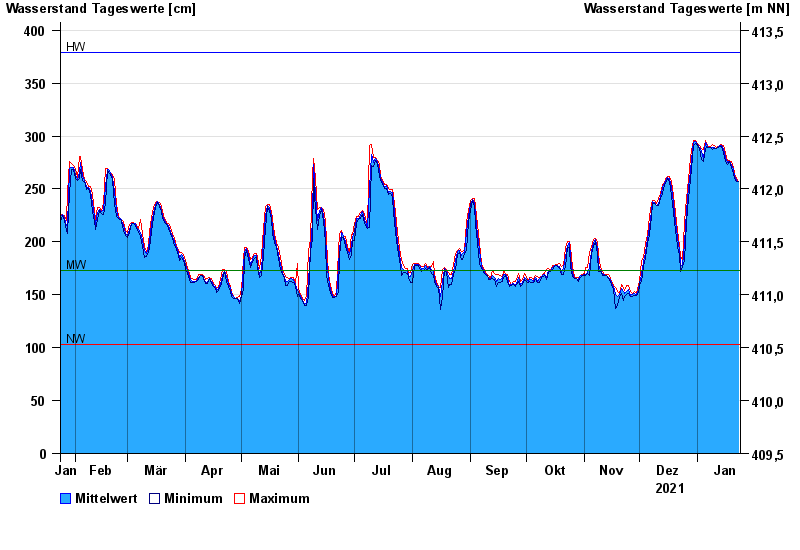
- Chart of year

Chart of year Aha / Altmühl
Waterlevel from 24.01.2021 to 23.01.2022
| Date | Mean value [cm] | Maximum [cm] | Minimum [cm] |
|---|---|---|---|
| 23.01.2022 | 257 | 257 | 257 |
| 22.01.2022 | 258 | 260 | 257 |
| 21.01.2022 | 262 | 265 | 260 |
| 20.01.2022 | 268 | 270 | 265 |
| 19.01.2022 | 273 | 276 | 270 |
| 18.01.2022 | 276 | 277 | 276 |
| 17.01.2022 | 275 | 276 | 273 |
© Bayerisches Landesamt für Umwelt 2024