
- Start >
- Rivers >
- Waterlevel >
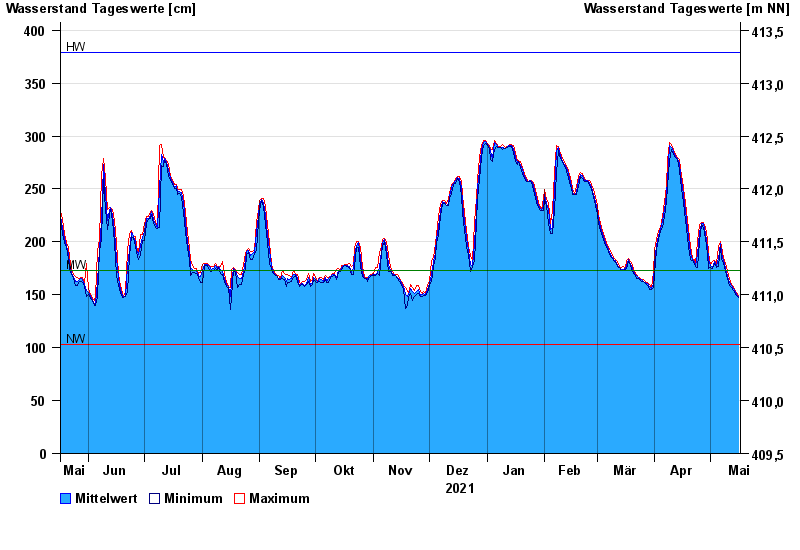
- Obere Donau >
- Aha >
- Chart of year

Chart of year Aha / Altmühl
Waterlevel from 17.05.2021 to 16.05.2022
| Date | Mean value [cm] | Maximum [cm] | Minimum [cm] |
|---|---|---|---|
| 16.05.2022 | 148 | 149 | 147 |
| 15.05.2022 | 150 | 152 | 149 |
| 14.05.2022 | 154 | 155 | 152 |
| 13.05.2022 | 156 | 158 | 154 |
| 12.05.2022 | 159 | 160 | 157 |
| 11.05.2022 | 162 | 165 | 159 |
| 10.05.2022 | 167 | 172 | 165 |
© Bayerisches Landesamt für Umwelt 2024