
- Start >
- Rivers >
- Waterlevel >
- Obere Donau >
- Aha >
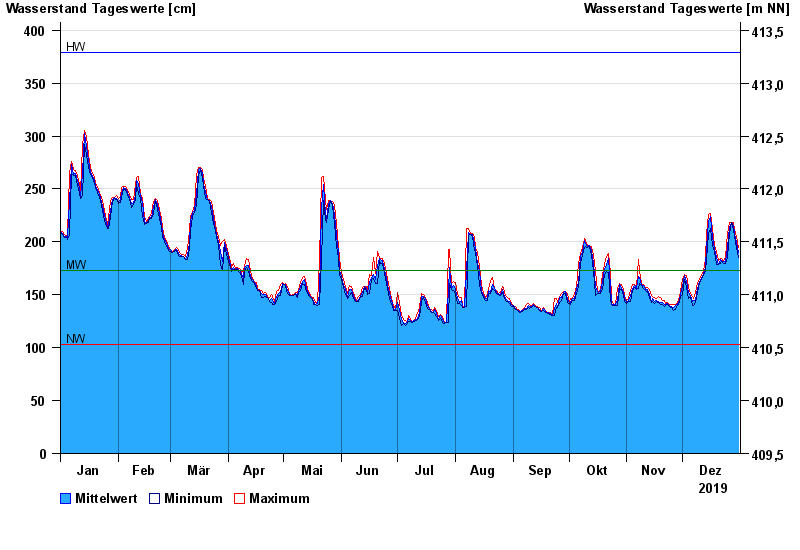
- Chart of year

Chart of year Aha / Altmühl
Waterlevel from 01.01.2019 to 31.12.2019
| Date | Mean value [cm] | Maximum [cm] | Minimum [cm] |
|---|---|---|---|
| 31.12.2019 | 190 | 195 | 185 |
| 30.12.2019 | 199 | 205 | 195 |
| 29.12.2019 | 208 | 212 | 205 |
| 28.12.2019 | 215 | 218 | 212 |
| 27.12.2019 | 218 | 218 | 218 |
| 26.12.2019 | 214 | 218 | 208 |
| 25.12.2019 | 195 | 208 | 185 |
© Bayerisches Landesamt für Umwelt 2024