
- Start >
- Rivers >
- Waterlevel >
- Isar >
- Raisting >
- Chart of year

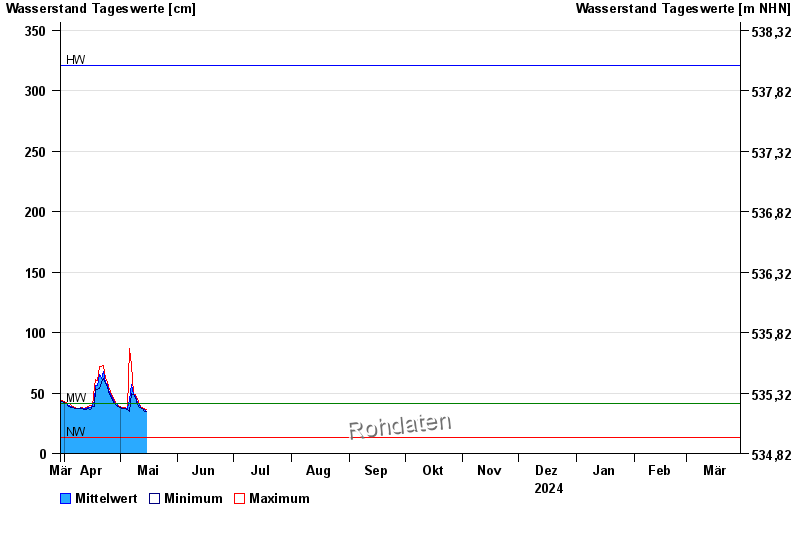
Chart of year Raisting / Rott
Waterlevel from 30.03.2024 to 29.03.2025
| Date | Mean value [cm] | Maximum [cm] | Minimum [cm] |
|---|---|---|---|
| 16.06.2024 | 47 | 48 | 45 |
| 15.06.2024 | 47 | 48 | 47 |
| 14.06.2024 | 51 | 53 | 48 |
| 13.06.2024 | 54 | 56 | 53 |
| 12.06.2024 | 61 | 66 | 56 |
| 11.06.2024 | 76 | 94 | 55 |
| 10.06.2024 | 115 | 160 | 93 |
© Bayerisches Landesamt für Umwelt 2024