
- Start >
- Rivers >
- Waterlevel >
- Isar >
- Puppling >
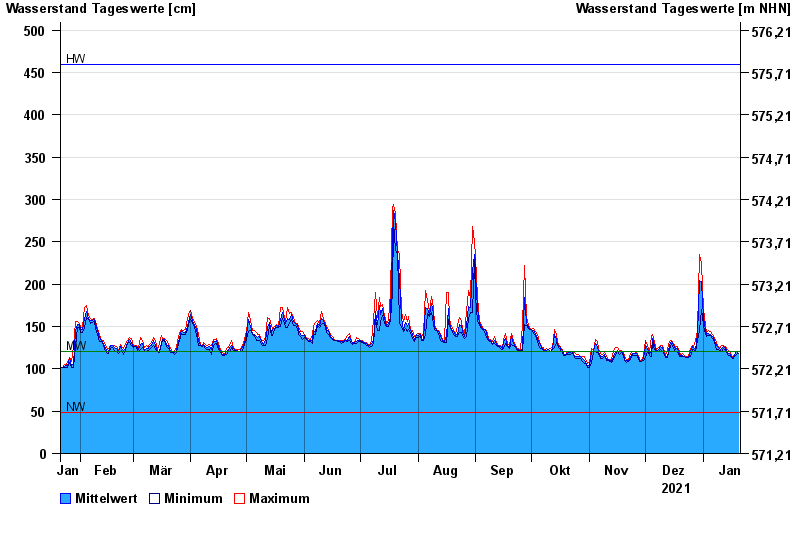
- Chart of year

Chart of year Puppling / Isar
Waterlevel from 21.01.2021 to 20.01.2022
| Date | Mean value [cm] | Maximum [cm] | Minimum [cm] |
|---|---|---|---|
| 20.01.2022 | 118 | 120 | 118 |
| 19.01.2022 | 120 | 121 | 117 |
| 18.01.2022 | 116 | 117 | 115 |
| 17.01.2022 | 113 | 115 | 112 |
| 16.01.2022 | 115 | 116 | 113 |
| 15.01.2022 | 118 | 120 | 116 |
| 14.01.2022 | 119 | 123 | 117 |
© Bayerisches Landesamt für Umwelt 2024