
- Start >
- Rivers >
- Waterlevel >
- Isar >
- Prien >
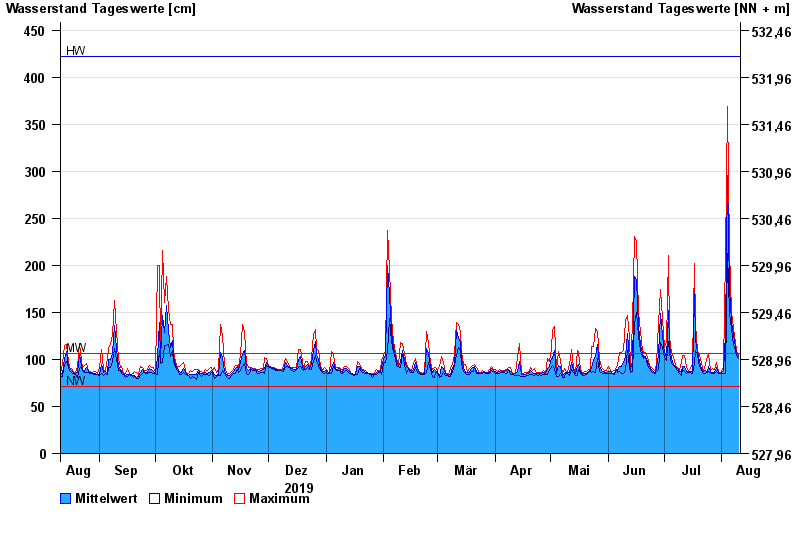
- Chart of year

Chart of year Prien / Prien
Waterlevel from 11.08.2019 to 10.08.2020
| Date | Mean value [cm] | Maximum [cm] | Minimum [cm] |
|---|---|---|---|
| 10.08.2020 | 103 | 104 | 101 |
| 09.08.2020 | 107 | 110 | 104 |
| 08.08.2020 | 113 | 118 | 110 |
| 07.08.2020 | 125 | 133 | 116 |
| 06.08.2020 | 140 | 150 | 132 |
| 05.08.2020 | 174 | 216 | 150 |
| 04.08.2020 | 296 | 369 | 213 |
© Bayerisches Landesamt für Umwelt 2024