
- Start >
- Rivers >
- Waterlevel >
- Isar >
- Oberhausen >
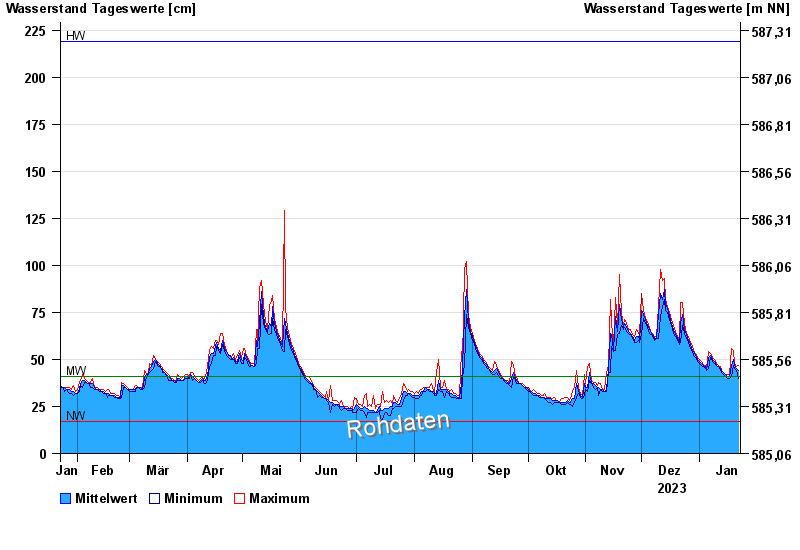
- Chart of year

Chart of year Oberhausen / Ach
Waterlevel from 23.01.2023 to 22.01.2024
| Date | Mean value [cm] | Maximum [cm] | Minimum [cm] |
|---|---|---|---|
| 22.01.2024 | 44 | 47 | 40 |
| 21.01.2024 | 45 | 46 | 44 |
| 20.01.2024 | 47 | 48 | 45 |
| 19.01.2024 | 50 | 55 | 47 |
| 18.01.2024 | 47 | 56 | 41 |
| 17.01.2024 | 41 | 42 | 40 |
| 16.01.2024 | 41 | 42 | 40 |
© Bayerisches Landesamt für Umwelt 2024