
- Start >
- Rivers >
- Waterlevel >
- Isar >
- Oberach >
- Chart of year

Chart of year Oberach / Weißach
Waterlevel from 27.09.2020 to 26.09.2021
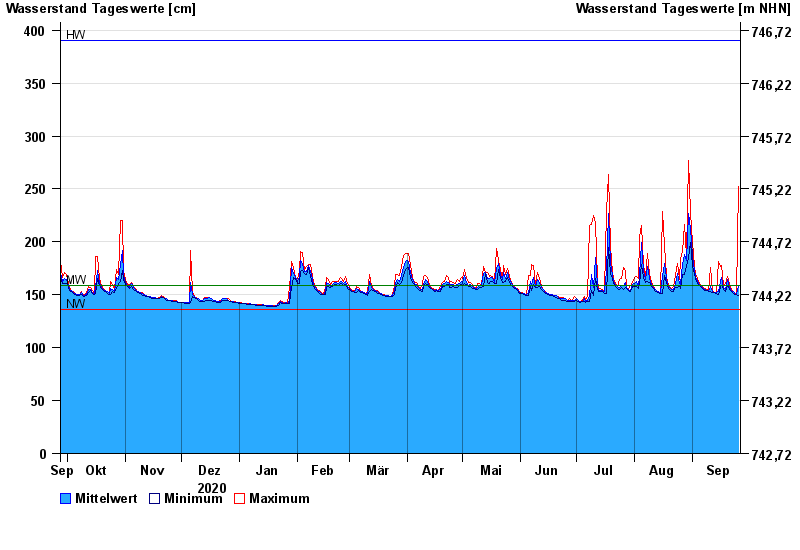
| Date | Mean value [cm] | Maximum [cm] | Minimum [cm] |
|---|---|---|---|
| 26.09.2021 | 159 | 252 | 149 |
| 25.09.2021 | 150 | 151 | 150 |
| 24.09.2021 | 151 | 152 | 150 |
| 23.09.2021 | 153 | 153 | 151 |
| 22.09.2021 | 154 | 155 | 153 |
| 21.09.2021 | 157 | 160 | 155 |
| 20.09.2021 | 164 | 167 | 159 |
© Bayerisches Landesamt für Umwelt 2024