
- Start >
- Rivers >
- Waterlevel >
- Isar >
- Oberach >
- Chart of year

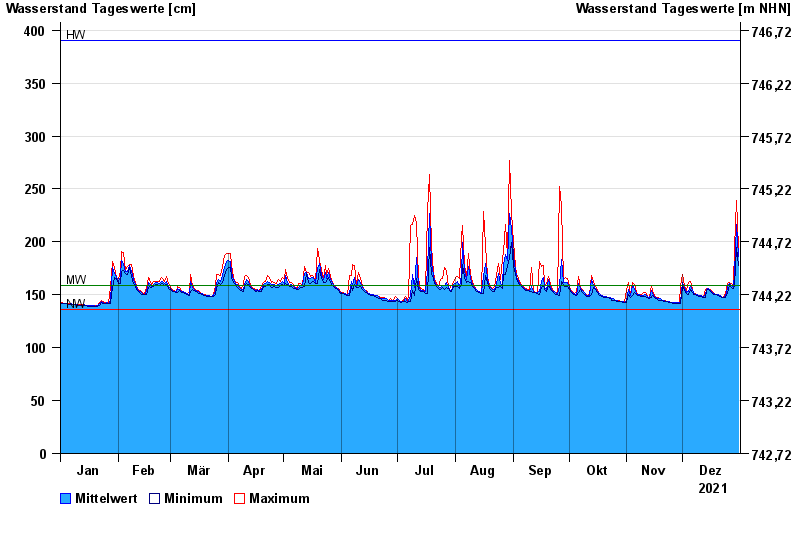
Chart of year Oberach / Weißach
Waterlevel from 01.01.2021 to 31.12.2021
| Date | Mean value [cm] | Maximum [cm] | Minimum [cm] |
|---|---|---|---|
| 31.12.2021 | 186 | 195 | 178 |
| 30.12.2021 | 216 | 239 | 195 |
| 29.12.2021 | 170 | 195 | 159 |
| 28.12.2021 | 157 | 159 | 156 |
| 27.12.2021 | 159 | 161 | 157 |
| 26.12.2021 | 161 | 162 | 160 |
| 25.12.2021 | 157 | 161 | 151 |
© Bayerisches Landesamt für Umwelt 2024