
- Start >
- Rivers >
- Waterlevel >
- Isar >
- Mühltal >
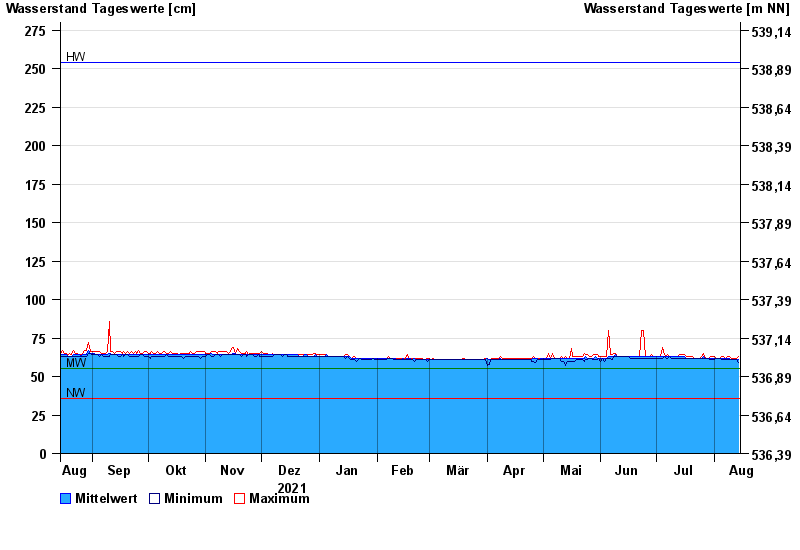
- Chart of year

Chart of year Mühltal / Glonn
Waterlevel from 15.08.2021 to 14.08.2022
| Date | Mean value [cm] | Maximum [cm] | Minimum [cm] |
|---|---|---|---|
| 14.08.2022 | 61 | 63 | 59 |
| 13.08.2022 | 61 | 62 | 61 |
| 12.08.2022 | 61 | 62 | 61 |
| 11.08.2022 | 61 | 62 | 61 |
| 10.08.2022 | 61 | 62 | 61 |
| 09.08.2022 | 62 | 63 | 61 |
| 08.08.2022 | 62 | 63 | 61 |
© Bayerisches Landesamt für Umwelt 2024