
- Start >
- Rivers >
- Waterlevel >
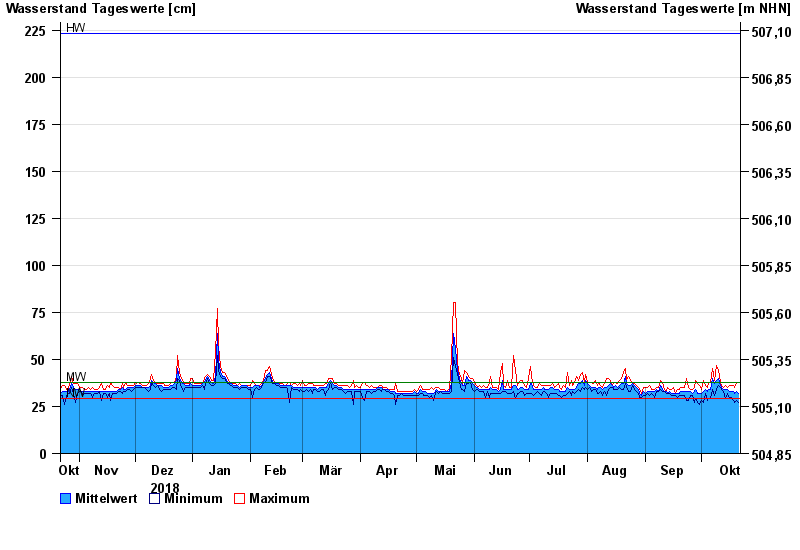
- Isar >
- Mering >
- Chart of year

Chart of year Mering / Paar
Waterlevel from 22.10.2018 to 21.10.2019
| Date | Mean value [cm] | Maximum [cm] | Minimum [cm] |
|---|---|---|---|
| 21.10.2019 | 32 | 38 | 27 |
| 20.10.2019 | 33 | 38 | 28 |
| 19.10.2019 | 32 | 35 | 27 |
| 18.10.2019 | 33 | 36 | 28 |
| 17.10.2019 | 33 | 36 | 30 |
| 16.10.2019 | 33 | 36 | 29 |
| 15.10.2019 | 34 | 35 | 32 |
© Bayerisches Landesamt für Umwelt 2024