
- Start >
- Rivers >
- Waterlevel >
- Isar >
- Grafrath >
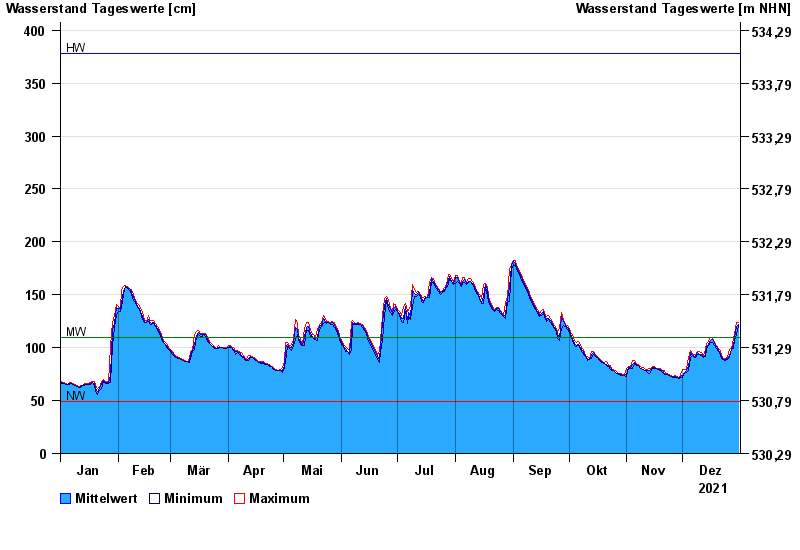
- Chart of year

Chart of year Grafrath / Amper
Waterlevel from 01.01.2021 to 31.12.2021
| Date | Mean value [cm] | Maximum [cm] | Minimum [cm] |
|---|---|---|---|
| 31.12.2021 | 122 | 124 | 121 |
| 30.12.2021 | 120 | 124 | 112 |
| 29.12.2021 | 109 | 112 | 107 |
| 28.12.2021 | 102 | 109 | 99 |
| 27.12.2021 | 98 | 99 | 98 |
| 26.12.2021 | 93 | 98 | 91 |
| 25.12.2021 | 90 | 91 | 89 |
© Bayerisches Landesamt für Umwelt 2024