
- Start >
- Rivers >
- Waterlevel >
- Isar >
- Eching >
- Chart of year

Chart of year Eching / Windach
Waterlevel from 17.07.2019 to 16.07.2020
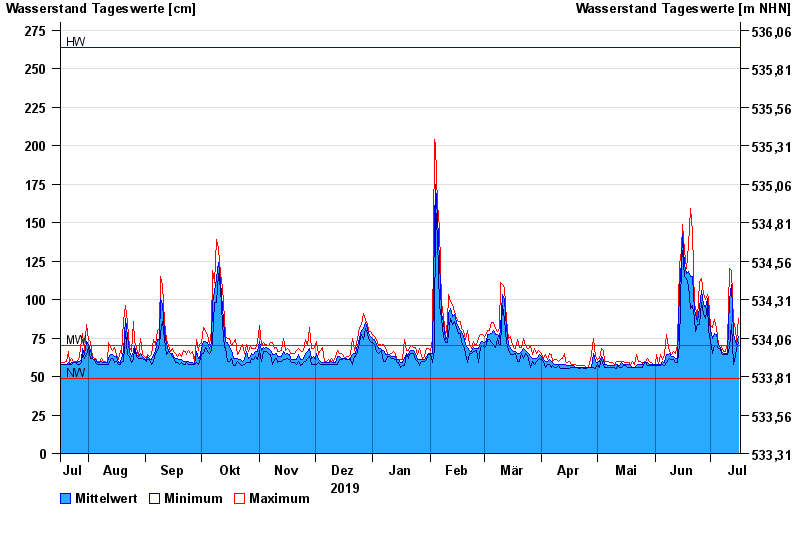
note
Pegel beeinflusst durch Kraftwerkssteuerung
| Date | Mean value [cm] | Maximum [cm] | Minimum [cm] |
|---|---|---|---|
| 16.07.2020 | 76 | 88 | 72 |
| 15.07.2020 | 71 | 73 | 68 |
| 14.07.2020 | 72 | 81 | 63 |
| 13.07.2020 | 77 | 86 | 58 |
| 12.07.2020 | 110 | 119 | 84 |
| 11.07.2020 | 100 | 120 | 69 |
| 10.07.2020 | 65 | 72 | 64 |
© Bayerisches Landesamt für Umwelt 2024