
- Start >
- Rivers >
- Waterlevel >
- Isar >
- Eching >
- Chart of year

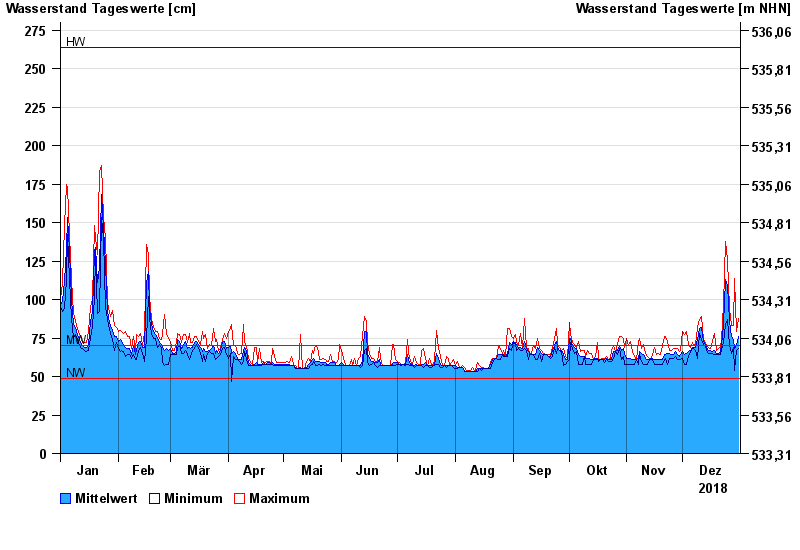
Chart of year Eching / Windach
Waterlevel from 01.01.2018 to 31.12.2018
note
Pegel beeinflusst durch Kraftwerkssteuerung
| Date | Mean value [cm] | Maximum [cm] | Minimum [cm] |
|---|---|---|---|
| 31.12.2018 | 76 | 88 | 68 |
| 30.12.2018 | 70 | 79 | 67 |
| 29.12.2018 | 68 | 114 | 54 |
| 28.12.2018 | 74 | 83 | 69 |
| 27.12.2018 | 76 | 83 | 65 |
| 26.12.2018 | 86 | 94 | 70 |
| 25.12.2018 | 109 | 126 | 87 |
© Bayerisches Landesamt für Umwelt 2024