
- Start >
- Rivers >
- Waterlevel >
- Isar >
- Bad Aibling >
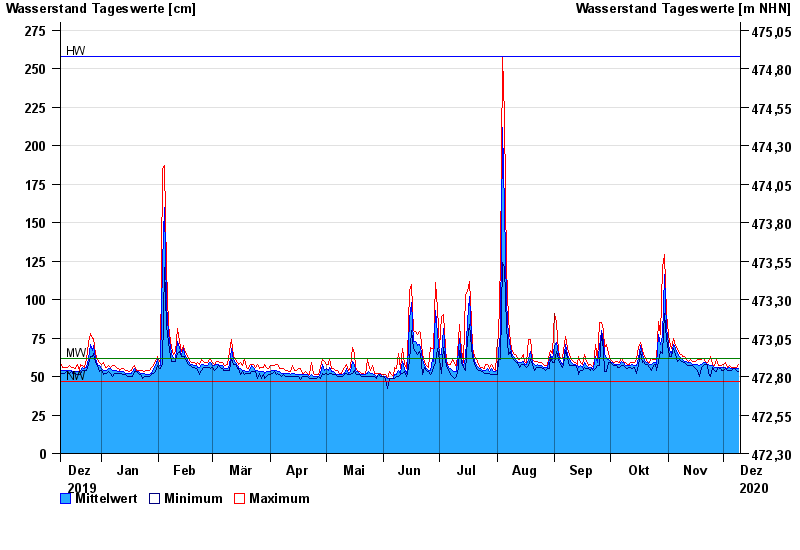
- Chart of year

Chart of year Bad Aibling / Glonn
Waterlevel from 10.12.2019 to 09.12.2020
| Date | Mean value [cm] | Maximum [cm] | Minimum [cm] |
|---|---|---|---|
| 09.12.2020 | 55 | 58 | 53 |
| 08.12.2020 | 55 | 56 | 54 |
| 07.12.2020 | 55 | 56 | 55 |
| 06.12.2020 | 55 | 56 | 55 |
| 05.12.2020 | 55 | 56 | 54 |
| 04.12.2020 | 56 | 57 | 54 |
| 03.12.2020 | 55 | 56 | 54 |
© Bayerisches Landesamt für Umwelt 2024