
- Start >
- Rivers >
- Waterlevel >
- Isar >
- Bad Aibling >
- Chart of year

Chart of year Bad Aibling / Glonn
Waterlevel from 01.01.2018 to 31.12.2018
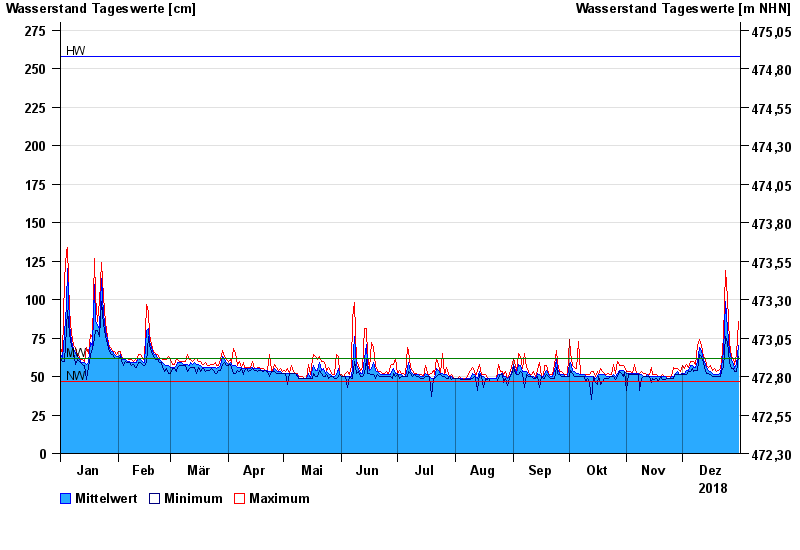
| Date | Mean value [cm] | Maximum [cm] | Minimum [cm] |
|---|---|---|---|
| 31.12.2018 | 70 | 86 | 63 |
| 30.12.2018 | 58 | 64 | 53 |
| 29.12.2018 | 55 | 58 | 53 |
| 28.12.2018 | 58 | 62 | 55 |
| 27.12.2018 | 61 | 63 | 55 |
| 26.12.2018 | 66 | 72 | 59 |
| 25.12.2018 | 81 | 101 | 72 |
© Bayerisches Landesamt für Umwelt 2024