
- Start >
- Rivers >
- Waterlevel >
- Isar >
- Achsheim >
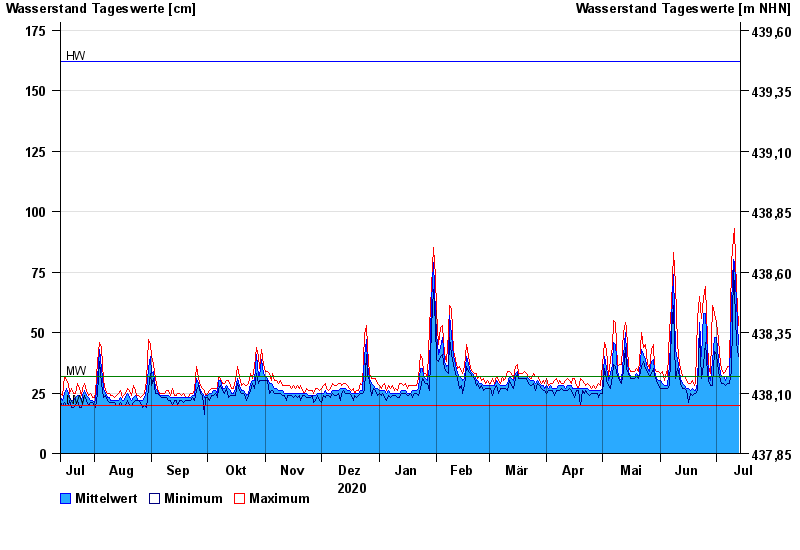
- Chart of year

Chart of year Achsheim / Schmutter
Waterlevel from 14.07.2020 to 13.07.2021
| Date | Mean value [cm] | Maximum [cm] | Minimum [cm] |
|---|---|---|---|
| 13.07.2021 | 45 | 53 | 40 |
| 12.07.2021 | 63 | 68 | 46 |
| 11.07.2021 | 79 | 93 | 67 |
| 10.07.2021 | 80 | 89 | 76 |
| 09.07.2021 | 62 | 79 | 34 |
| 08.07.2021 | 32 | 36 | 29 |
| 07.07.2021 | 32 | 36 | 29 |
© Bayerisches Landesamt für Umwelt 2024