
- Start >
- Rivers >
- Waterlevel >
- Inn >
- Valley >
- Chart of year

Chart of year Valley / Mangfall
Waterlevel from 01.01.2023 to 31.12.2023
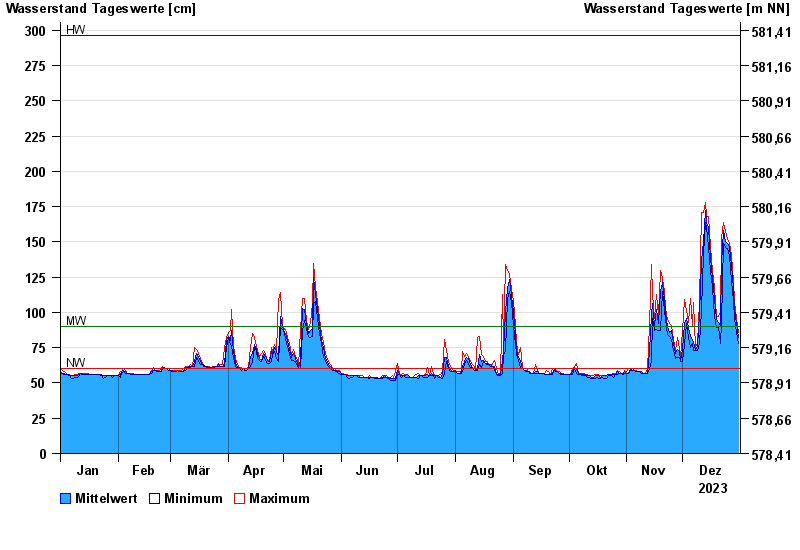
| Date | Mean value [cm] | Maximum [cm] | Minimum [cm] |
|---|---|---|---|
| 31.12.2023 | 82 | 86 | 78 |
| 30.12.2023 | 92 | 96 | 86 |
| 29.12.2023 | 103 | 108 | 96 |
| 28.12.2023 | 116 | 122 | 108 |
| 27.12.2023 | 133 | 140 | 122 |
| 26.12.2023 | 146 | 149 | 140 |
| 25.12.2023 | 149 | 152 | 145 |
© Bayerisches Landesamt für Umwelt 2024