
- Start >
- Rivers >
- Waterlevel >
- Inn >
- Schneizlreuth Weißbach >
- Chart of year

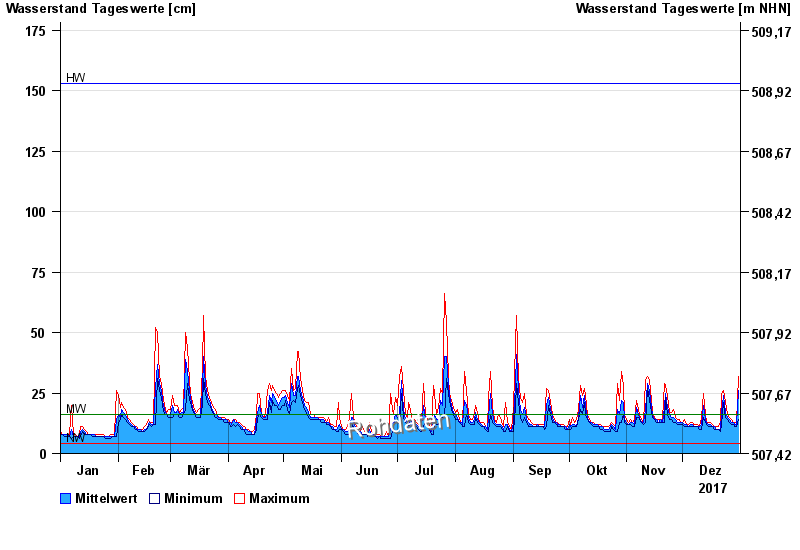
Chart of year Schneizlreuth Weißbach / Weißbach
Waterlevel from 01.01.2017 to 31.12.2017
| Date | Mean value [cm] | Maximum [cm] | Minimum [cm] |
|---|---|---|---|
| 31.12.2017 | 26 | 32 | 14 |
| 30.12.2017 | 12 | 13 | 11 |
| 29.12.2017 | 12 | 13 | 11 |
| 28.12.2017 | 13 | 13 | 12 |
| 27.12.2017 | 13 | 14 | 12 |
| 26.12.2017 | 14 | 15 | 13 |
| 25.12.2017 | 15 | 16 | 14 |
© Bayerisches Landesamt für Umwelt 2024