
- Start >
- Rivers >
- Waterlevel >
- Inn >
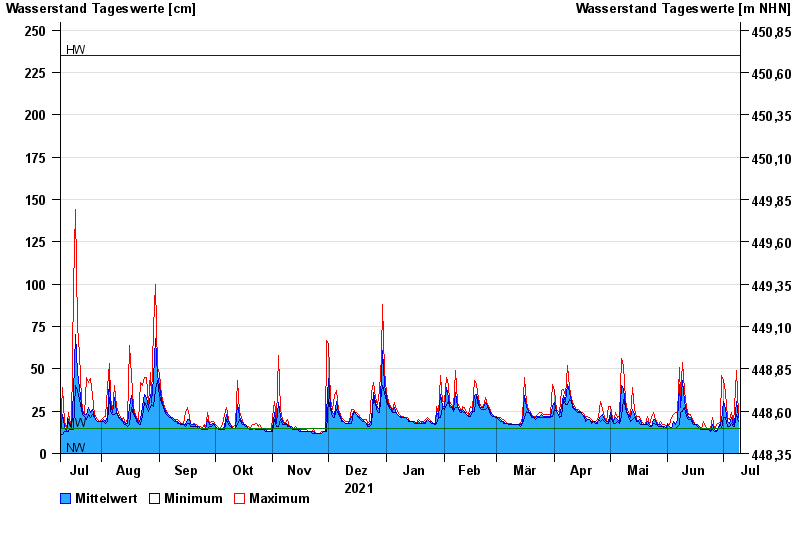
- Piding >
- Chart of year

Chart of year Piding / Stoißer Ache
Waterlevel from 10.07.2021 to 09.07.2022
| Date | Mean value [cm] | Maximum [cm] | Minimum [cm] |
|---|---|---|---|
| 09.07.2022 | 21 | 23 | 19 |
| 08.07.2022 | 31 | 49 | 23 |
| 07.07.2022 | 18 | 27 | 16 |
| 06.07.2022 | 17 | 18 | 16 |
| 05.07.2022 | 21 | 24 | 18 |
| 04.07.2022 | 18 | 20 | 16 |
| 03.07.2022 | 19 | 21 | 16 |
© Bayerisches Landesamt für Umwelt 2024