
- Start >
- Rivers >
- Waterlevel >
- Inn >
- München >
- Chart of year

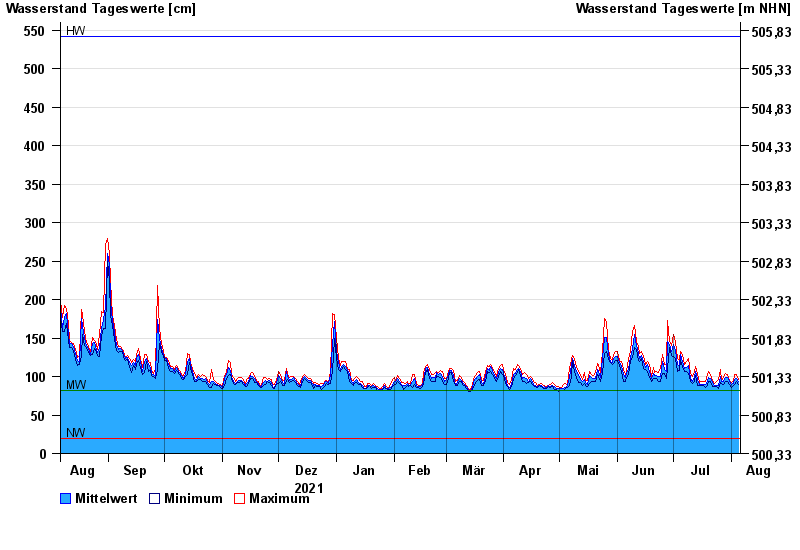
Chart of year München / Isar
Waterlevel from 06.08.2021 to 05.08.2022
| Date | Mean value [cm] | Maximum [cm] | Minimum [cm] |
|---|---|---|---|
| 05.08.2022 | 93 | 96 | 90 |
| 04.08.2022 | 98 | 103 | 93 |
| 03.08.2022 | 96 | 103 | 90 |
| 02.08.2022 | 91 | 93 | 89 |
| 01.08.2022 | 90 | 92 | 86 |
| 31.07.2022 | 93 | 95 | 90 |
| 30.07.2022 | 99 | 103 | 93 |
© Bayerisches Landesamt für Umwelt 2024