
- Start >
- Rivers >
- Waterlevel >
- Inn >
- Mühldorf >
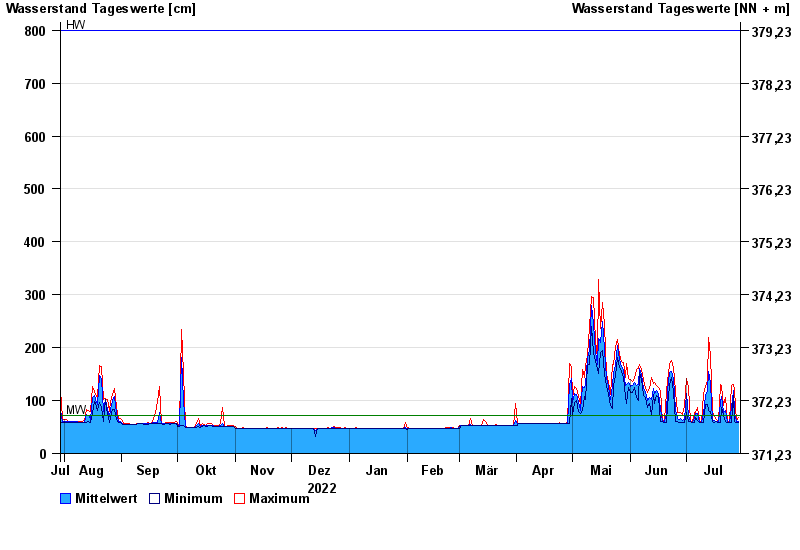
- Chart of year

Chart of year Mühldorf / Inn
Waterlevel from 30.07.2022 to 29.07.2023
| Date | Mean value [cm] | Maximum [cm] | Minimum [cm] |
|---|---|---|---|
| 29.07.2023 | 61 | 68 | 59 |
| 28.07.2023 | 60 | 60 | 59 |
| 27.07.2023 | 77 | 119 | 60 |
| 26.07.2023 | 119 | 131 | 109 |
| 25.07.2023 | 87 | 128 | 59 |
| 24.07.2023 | 59 | 60 | 59 |
| 23.07.2023 | 60 | 62 | 59 |
© Bayerisches Landesamt für Umwelt 2024