
- Start >
- Rivers >
- Waterlevel >
- Inn >
- Gaißach >
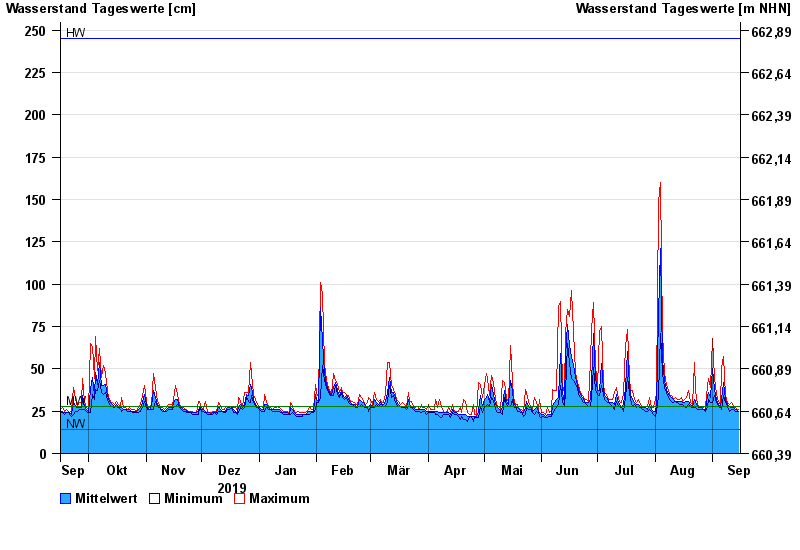
- Chart of year

Chart of year Gaißach / Große Gaißach
Waterlevel from 16.09.2019 to 15.09.2020
| Date | Mean value [cm] | Maximum [cm] | Minimum [cm] |
|---|---|---|---|
| 15.09.2020 | 25 | 26 | 25 |
| 14.09.2020 | 26 | 26 | 25 |
| 13.09.2020 | 26 | 27 | 25 |
| 12.09.2020 | 27 | 28 | 26 |
| 11.09.2020 | 27 | 30 | 26 |
| 10.09.2020 | 28 | 29 | 25 |
| 09.09.2020 | 29 | 30 | 28 |
© Bayerisches Landesamt für Umwelt 2024