
- Start >
- Rivers >
- Waterlevel >
- Inn >
- Feldolling >
- Chart of year

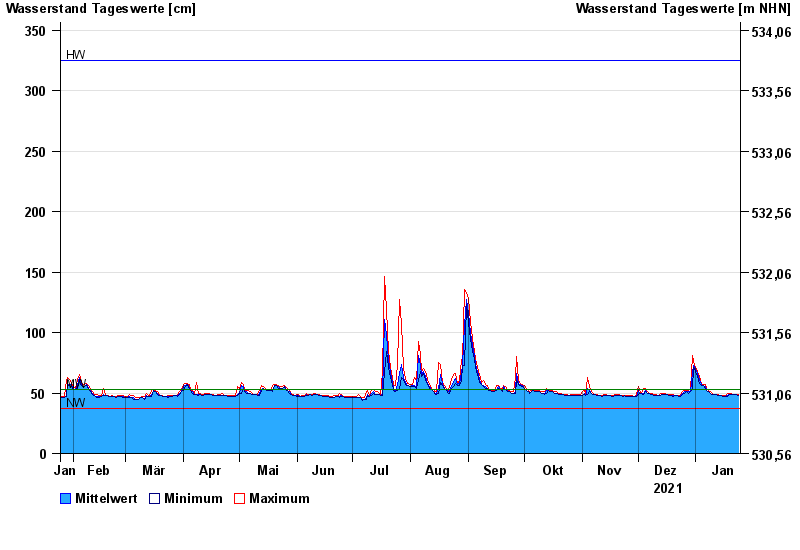
Chart of year Feldolling / Mangfall
Waterlevel from 25.01.2021 to 24.01.2022
| Date | Mean value [cm] | Maximum [cm] | Minimum [cm] |
|---|---|---|---|
| 24.01.2022 | 48 | 49 | 48 |
| 23.01.2022 | 49 | 49 | 49 |
| 22.01.2022 | 49 | 49 | 49 |
| 21.01.2022 | 49 | 49 | 49 |
| 20.01.2022 | 49 | 50 | 49 |
| 19.01.2022 | 49 | 50 | 49 |
| 18.01.2022 | 48 | 50 | 47 |
© Bayerisches Landesamt für Umwelt 2024