
- Start >
- Rivers >
- Waterlevel >
- Iller - Lech - Bodensee >
- Spielmannsau >
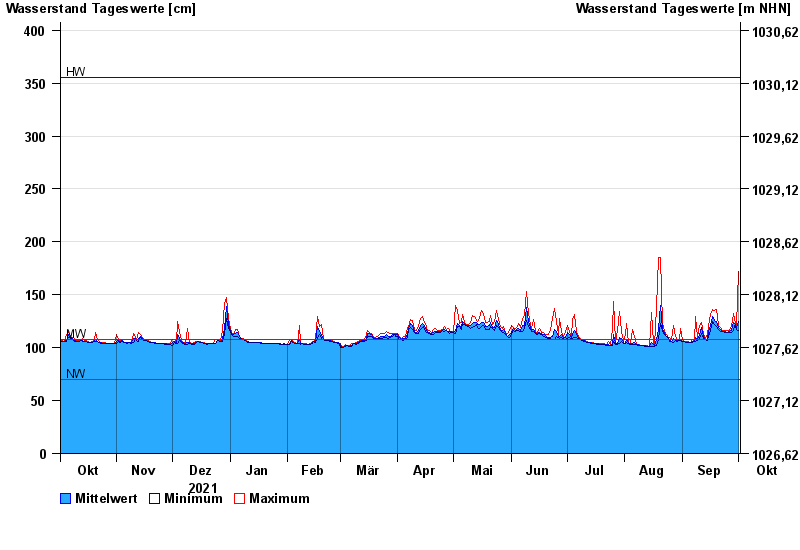
- Chart of year

Chart of year Spielmannsau / Traufbach
Waterlevel from 02.10.2021 to 01.10.2022
| Date | Mean value [cm] | Maximum [cm] | Minimum [cm] |
|---|---|---|---|
| 01.10.2022 | 125 | 172 | 116 |
| 30.09.2022 | 119 | 121 | 117 |
| 29.09.2022 | 123 | 127 | 121 |
| 28.09.2022 | 124 | 132 | 116 |
| 27.09.2022 | 116 | 120 | 114 |
| 26.09.2022 | 115 | 116 | 114 |
| 25.09.2022 | 114 | 116 | 114 |
© Bayerisches Landesamt für Umwelt 2024