
- Start >
- Rivers >
- Waterlevel >
- Iller - Lech - Bodensee >
- Oberstaufen >
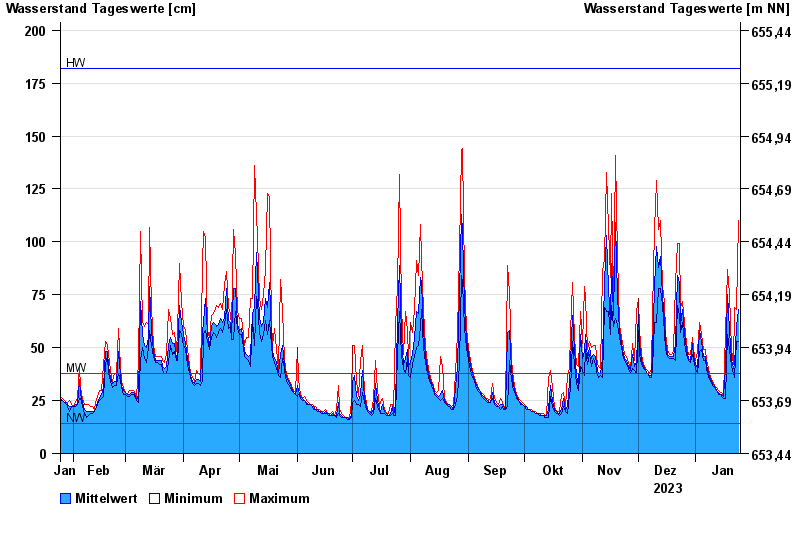
- Chart of year

Chart of year Oberstaufen / Weißach
Waterlevel from 25.01.2023 to 24.01.2024
| Date | Mean value [cm] | Maximum [cm] | Minimum [cm] |
|---|---|---|---|
| 24.01.2024 | 68 | 110 | 53 |
| 23.01.2024 | 60 | 68 | 53 |
| 22.01.2024 | 42 | 69 | 36 |
| 21.01.2024 | 40 | 42 | 38 |
| 20.01.2024 | 44 | 49 | 41 |
| 19.01.2024 | 58 | 75 | 49 |
| 18.01.2024 | 75 | 87 | 56 |
© Bayerisches Landesamt für Umwelt 2024