
- Start >
- Rivers >
- Waterlevel >
- Iller - Lech - Bodensee >
- Oberstaufen >
- Chart of year

Chart of year Oberstaufen / Weißach
Waterlevel from 17.07.2020 to 16.07.2021
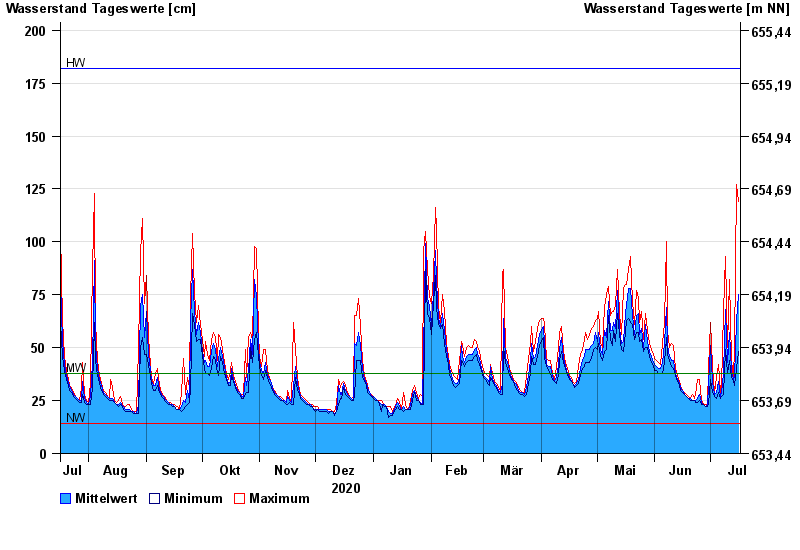
| Date | Mean value [cm] | Maximum [cm] | Minimum [cm] |
|---|---|---|---|
| 16.07.2021 | 75 | 119 | 48 |
| 15.07.2021 | 63 | 127 | 40 |
| 14.07.2021 | 36 | 50 | 32 |
| 13.07.2021 | 35 | 36 | 34 |
| 12.07.2021 | 39 | 44 | 36 |
| 11.07.2021 | 57 | 82 | 44 |
| 10.07.2021 | 43 | 50 | 38 |
© Bayerisches Landesamt für Umwelt 2024