
- Start >
- Rivers >
- Waterlevel >
- Iller - Lech - Bodensee >
- Lauben >
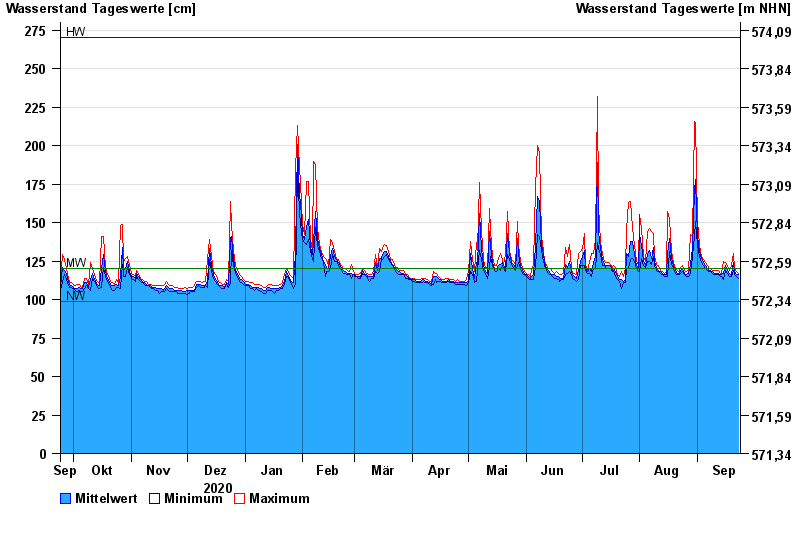
- Chart of year

Chart of year Lauben / Günz
Waterlevel from 24.09.2020 to 23.09.2021
| Date | Mean value [cm] | Maximum [cm] | Minimum [cm] |
|---|---|---|---|
| 23.09.2021 | 116 | 117 | 114 |
| 22.09.2021 | 116 | 118 | 115 |
| 21.09.2021 | 118 | 120 | 116 |
| 20.09.2021 | 124 | 130 | 119 |
| 19.09.2021 | 116 | 122 | 115 |
| 18.09.2021 | 117 | 119 | 115 |
| 17.09.2021 | 119 | 122 | 117 |
© Bayerisches Landesamt für Umwelt 2024