
- Start >
- Rivers >
- Waterlevel >
- Iller - Lech - Bodensee >
- Landsberg >
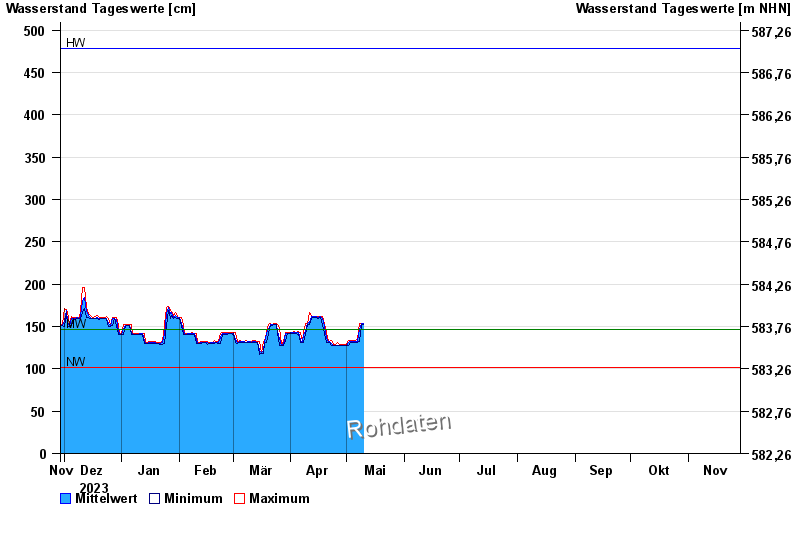
- Chart of year

Chart of year Landsberg / Lech
Waterlevel from 29.11.2023 to 28.11.2024
note
Messwerte beeinflusst durch Kraftwerkssteuerungen.
| Date | Mean value [cm] | Maximum [cm] | Minimum [cm] |
|---|---|---|---|
| 20.05.2024 | 152 | 153 | 151 |
| 19.05.2024 | 157 | 162 | 151 |
| 18.05.2024 | 162 | 163 | 161 |
| 17.05.2024 | 162 | 163 | 161 |
| 16.05.2024 | 162 | 166 | 159 |
| 15.05.2024 | 155 | 162 | 151 |
| 14.05.2024 | 152 | 153 | 151 |
© Bayerisches Landesamt für Umwelt 2024