
- Start >
- Rivers >
- Waterlevel >
- Iller - Lech - Bodensee >
- Landsberg >
- Chart of year

Chart of year Landsberg / Lech
Waterlevel from 06.10.2021 to 05.10.2022
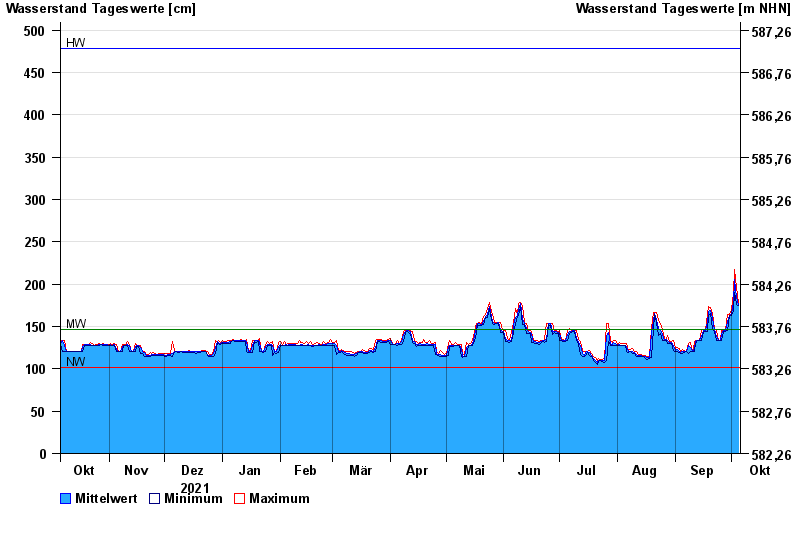
note
Messwerte beeinflusst durch Kraftwerkssteuerungen.
| Date | Mean value [cm] | Maximum [cm] | Minimum [cm] |
|---|---|---|---|
| 05.10.2022 | 176 | 177 | 175 |
| 04.10.2022 | 184 | 196 | 176 |
| 03.10.2022 | 206 | 217 | 190 |
| 02.10.2022 | 178 | 190 | 169 |
| 01.10.2022 | 165 | 170 | 163 |
| 30.09.2022 | 163 | 164 | 163 |
| 29.09.2022 | 156 | 164 | 145 |
© Bayerisches Landesamt für Umwelt 2024