
- Start >
- Rivers >
- Waterlevel >
- Iller - Lech - Bodensee >
- Greifenmühle >
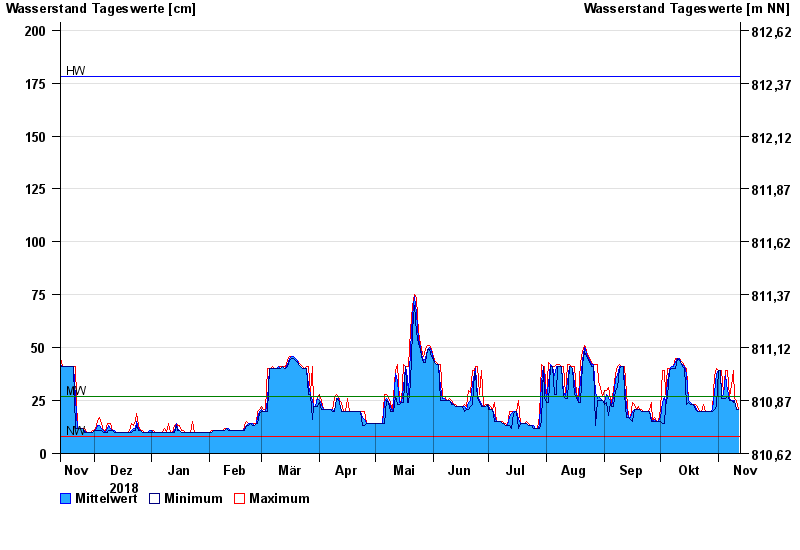
- Chart of year

Chart of year Greifenmühle / Rottach
Waterlevel from 13.11.2018 to 12.11.2019
| Date | Mean value [cm] | Maximum [cm] | Minimum [cm] |
|---|---|---|---|
| 12.11.2019 | 21 | 21 | 21 |
| 11.11.2019 | 21 | 25 | 21 |
| 10.11.2019 | 25 | 26 | 25 |
| 09.11.2019 | 25 | 39 | 24 |
| 08.11.2019 | 25 | 32 | 25 |
| 07.11.2019 | 26 | 27 | 25 |
| 06.11.2019 | 30 | 39 | 27 |
© Bayerisches Landesamt für Umwelt 2024