
- Start >
- Rivers >
- Waterlevel >
- Iller - Lech - Bodensee >
- Görisried >
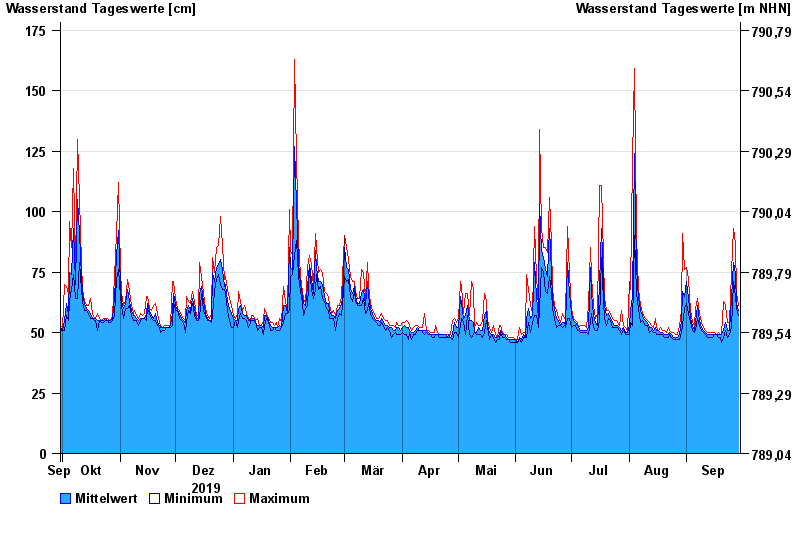
- Chart of year

Chart of year Görisried / Waldbach
Waterlevel from 30.09.2019 to 29.09.2020
| Date | Mean value [cm] | Maximum [cm] | Minimum [cm] |
|---|---|---|---|
| 29.09.2020 | 59 | 61 | 57 |
| 28.09.2020 | 62 | 66 | 60 |
| 27.09.2020 | 74 | 87 | 65 |
| 26.09.2020 | 79 | 93 | 71 |
| 25.09.2020 | 64 | 75 | 52 |
| 24.09.2020 | 51 | 54 | 49 |
| 23.09.2020 | 51 | 54 | 48 |
© Bayerisches Landesamt für Umwelt 2024