
- Start >
- Rivers >
- Waterlevel >
- Iller - Lech - Bodensee >
- Görisried >
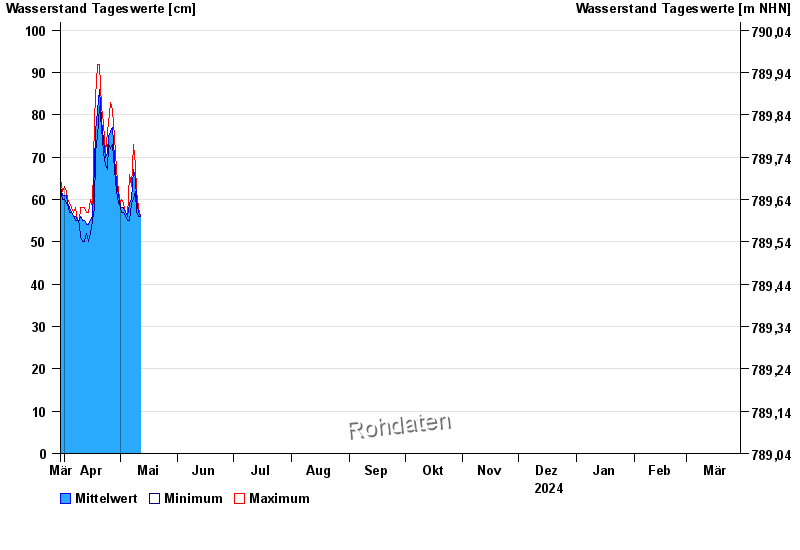
- Chart of year

Chart of year Görisried / Waldbach
Waterlevel from 30.03.2024 to 29.03.2025
| Date | Mean value [cm] | Maximum [cm] | Minimum [cm] |
|---|---|---|---|
| 28.04.2024 | 73 | 75 | 71 |
| 27.04.2024 | 77 | 81 | 73 |
| 26.04.2024 | 76 | 83 | 72 |
| 25.04.2024 | 75 | 78 | 73 |
| 24.04.2024 | 71 | 76 | 67 |
| 23.04.2024 | 70 | 71 | 68 |
| 22.04.2024 | 74 | 78 | 71 |
© Bayerisches Landesamt für Umwelt 2024