
- Start >
- Rivers >
- Waterlevel >
- Iller - Lech - Bodensee >
- Görisried >
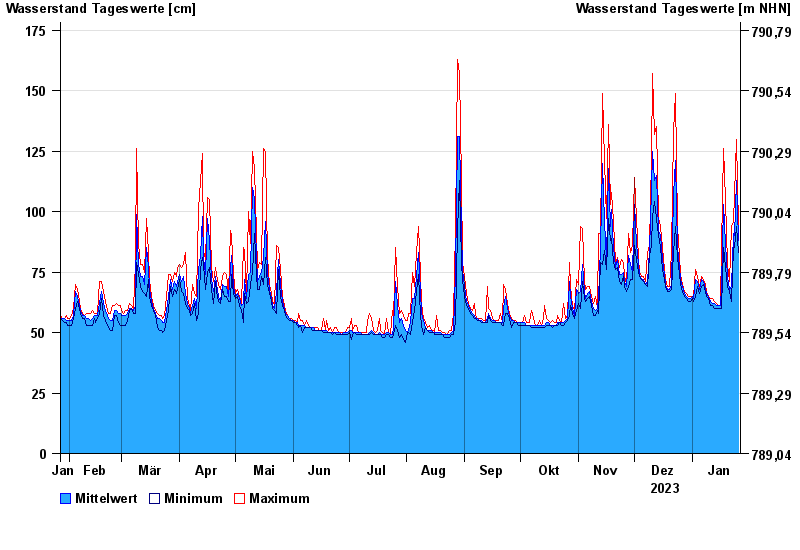
- Chart of year

Chart of year Görisried / Waldbach
Waterlevel from 27.01.2023 to 26.01.2024
| Date | Mean value [cm] | Maximum [cm] | Minimum [cm] |
|---|---|---|---|
| 26.01.2024 | 88 | 94 | 83 |
| 25.01.2024 | 113 | 130 | 94 |
| 24.01.2024 | 90 | 107 | 85 |
| 23.01.2024 | 91 | 96 | 85 |
| 22.01.2024 | 69 | 94 | 63 |
| 21.01.2024 | 68 | 71 | 67 |
| 20.01.2024 | 73 | 78 | 69 |
© Bayerisches Landesamt für Umwelt 2024