
- Start >
- Rivers >
- Waterlevel >
- Iller - Lech - Bodensee >
- Görisried >
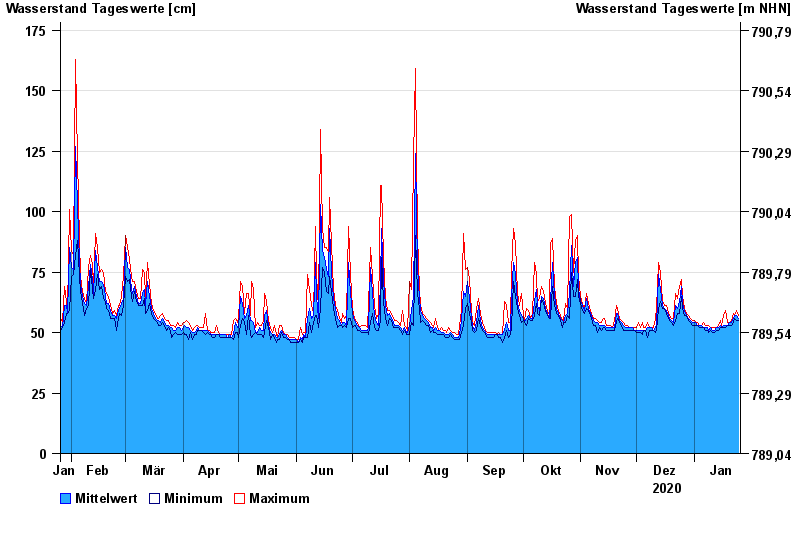
- Chart of year

Chart of year Görisried / Waldbach
Waterlevel from 26.01.2020 to 25.01.2021
| Date | Mean value [cm] | Maximum [cm] | Minimum [cm] |
|---|---|---|---|
| 25.01.2021 | 56 | 57 | 55 |
| 24.01.2021 | 57 | 59 | 55 |
| 23.01.2021 | 57 | 57 | 56 |
| 22.01.2021 | 56 | 58 | 54 |
| 21.01.2021 | 54 | 55 | 53 |
| 20.01.2021 | 54 | 54 | 53 |
| 19.01.2021 | 53 | 54 | 53 |
© Bayerisches Landesamt für Umwelt 2024