
- Start >
- Rivers >
- Waterlevel >
- Iller - Lech - Bodensee >
- Füssen >
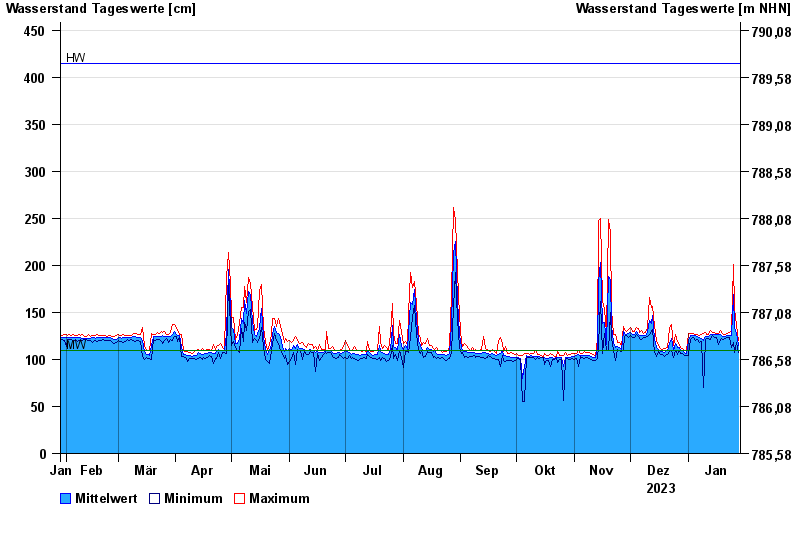
- Chart of year

Chart of year Füssen / Lech
Waterlevel from 29.01.2023 to 28.01.2024
| Date | Mean value [cm] | Maximum [cm] | Minimum [cm] |
|---|---|---|---|
| 28.01.2024 | 115 | 120 | 107 |
| 27.01.2024 | 128 | 136 | 118 |
| 26.01.2024 | 134 | 154 | 107 |
| 25.01.2024 | 169 | 201 | 118 |
| 24.01.2024 | 125 | 131 | 113 |
| 23.01.2024 | 125 | 129 | 123 |
| 22.01.2024 | 125 | 128 | 123 |
© Bayerisches Landesamt für Umwelt 2024