
- Start >
- Rivers >
- Waterlevel >
- Iller - Lech - Bodensee >
- Eschach >
- Chart of year

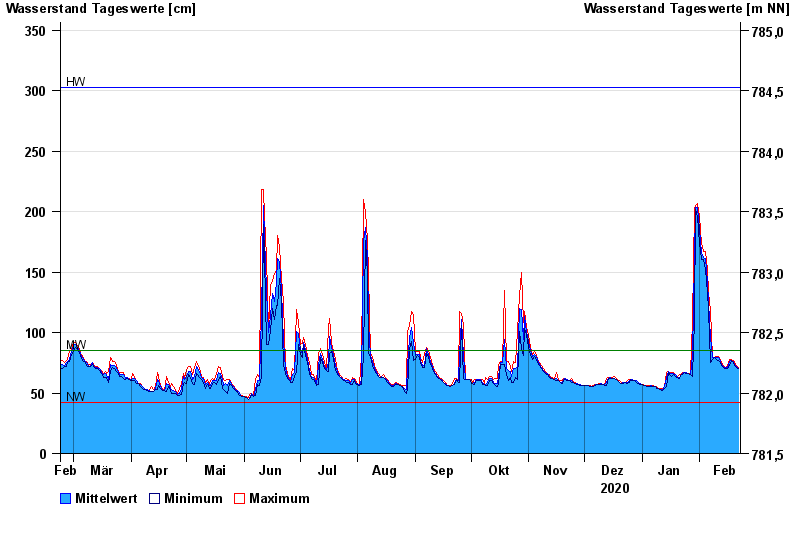
Chart of year Eschach / Füssener Achen
Waterlevel from 23.02.2020 to 22.02.2021
| Date | Mean value [cm] | Maximum [cm] | Minimum [cm] |
|---|---|---|---|
| 22.02.2021 | 70 | 71 | 70 |
| 21.02.2021 | 72 | 73 | 71 |
| 20.02.2021 | 74 | 75 | 73 |
| 19.02.2021 | 76 | 77 | 75 |
| 18.02.2021 | 77 | 78 | 77 |
| 17.02.2021 | 76 | 78 | 73 |
| 16.02.2021 | 71 | 73 | 70 |
© Bayerisches Landesamt für Umwelt 2024