
- Start >
- Rivers >
- Waterlevel >
- Iller - Lech - Bodensee >
- Eschach >
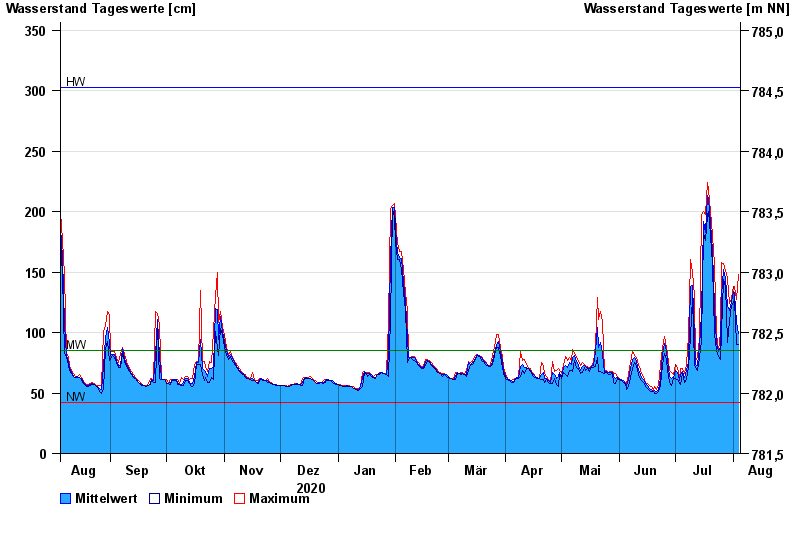
- Chart of year

Chart of year Eschach / Füssener Achen
Waterlevel from 05.08.2020 to 04.08.2021
| Date | Mean value [cm] | Maximum [cm] | Minimum [cm] |
|---|---|---|---|
| 04.08.2021 | 99 | 148 | 90 |
| 03.08.2021 | 108 | 127 | 90 |
| 02.08.2021 | 132 | 138 | 127 |
| 01.08.2021 | 134 | 138 | 125 |
| 31.07.2021 | 126 | 128 | 122 |
| 30.07.2021 | 118 | 124 | 110 |
| 29.07.2021 | 122 | 145 | 92 |
© Bayerisches Landesamt für Umwelt 2024