
- Start >
- Rivers >
- Waterlevel >
- Iller - Lech - Bodensee >
- Eschach >
- Chart of year

Chart of year Eschach / Füssener Achen
Waterlevel from 01.01.2018 to 31.12.2018
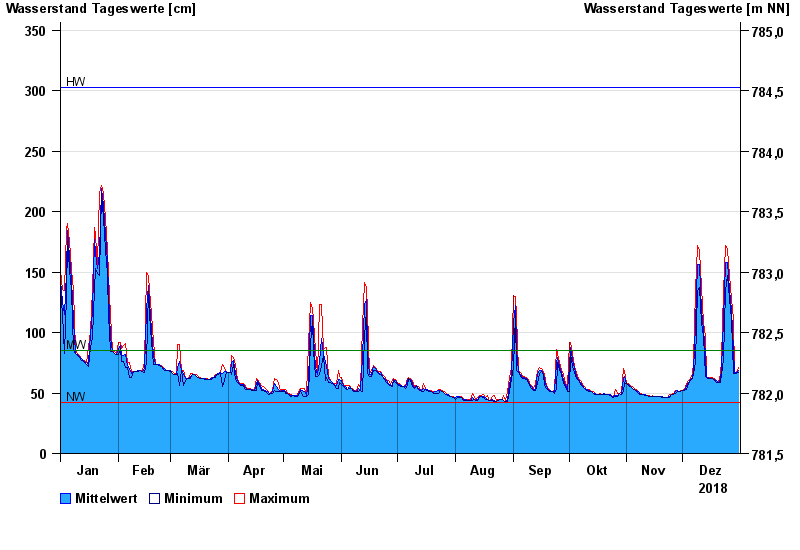
| Date | Mean value [cm] | Maximum [cm] | Minimum [cm] |
|---|---|---|---|
| 31.12.2018 | 69 | 71 | 67 |
| 30.12.2018 | 67 | 67 | 66 |
| 29.12.2018 | 66 | 66 | 66 |
| 28.12.2018 | 86 | 111 | 66 |
| 27.12.2018 | 118 | 127 | 111 |
| 26.12.2018 | 136 | 147 | 127 |
| 25.12.2018 | 158 | 169 | 147 |
© Bayerisches Landesamt für Umwelt 2024