
- Start >
- Rivers >
- Waterlevel >
- Oberer Main - Elbe >
- Unterlangenstadt >
- Chart of year

Chart of year Unterlangenstadt / Rodach
Waterlevel from 01.01.2023 to 31.12.2023
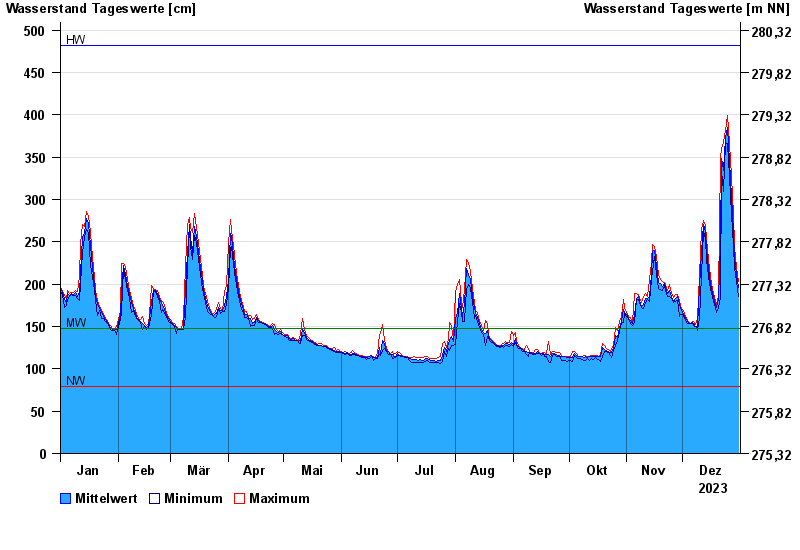
| Date | Mean value [cm] | Maximum [cm] | Minimum [cm] |
|---|---|---|---|
| 31.12.2023 | 196 | 203 | 185 |
| 30.12.2023 | 211 | 220 | 203 |
| 29.12.2023 | 231 | 245 | 220 |
| 28.12.2023 | 262 | 282 | 245 |
| 27.12.2023 | 303 | 327 | 282 |
| 26.12.2023 | 345 | 366 | 327 |
| 25.12.2023 | 385 | 399 | 366 |
© Bayerisches Landesamt für Umwelt 2024