
- Start >
- Rivers >
- Waterlevel >
- Oberer Main - Elbe >
- Trunstadt >
- Chart of year

Chart of year Trunstadt / Main
Waterlevel from 26.02.2020 to 25.02.2021
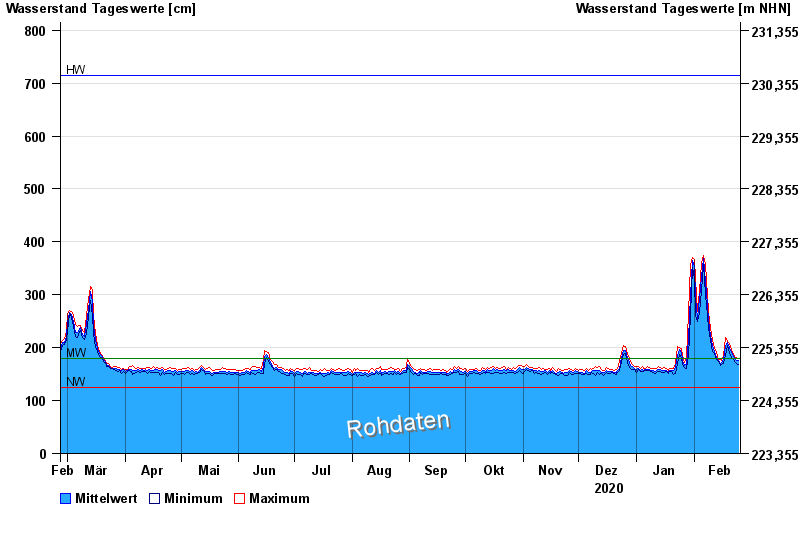
| Date | Mean value [cm] | Maximum [cm] | Minimum [cm] |
|---|---|---|---|
| 25.02.2021 | 176 | 180 | 168 |
| 24.02.2021 | 176 | 182 | 170 |
| 23.02.2021 | 179 | 183 | 174 |
| 22.02.2021 | 183 | 188 | 177 |
| 21.02.2021 | 190 | 196 | 181 |
| 20.02.2021 | 201 | 208 | 191 |
| 19.02.2021 | 209 | 212 | 205 |
© Bayerisches Landesamt für Umwelt 2024