
- Start >
- Rivers >
- Waterlevel >
- Oberer Main - Elbe >
- Schenkenau >
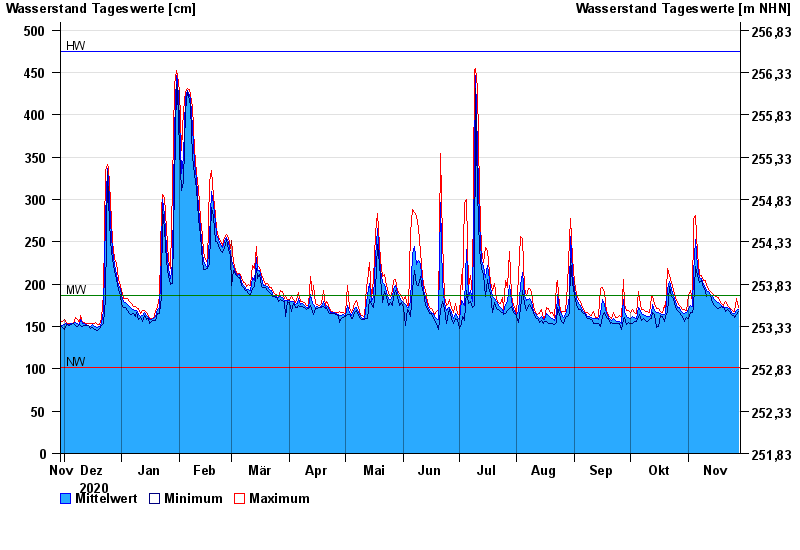
- Chart of year

Chart of year Schenkenau / Itz
Waterlevel from 29.11.2020 to 28.11.2021
| Date | Mean value [cm] | Maximum [cm] | Minimum [cm] |
|---|---|---|---|
| 28.11.2021 | 170 | 172 | 168 |
| 27.11.2021 | 169 | 183 | 164 |
| 26.11.2021 | 165 | 168 | 161 |
| 25.11.2021 | 165 | 168 | 163 |
| 24.11.2021 | 166 | 170 | 164 |
| 23.11.2021 | 171 | 173 | 168 |
| 22.11.2021 | 172 | 175 | 170 |
© Bayerisches Landesamt für Umwelt 2024