
- Start >
- Rivers >
- Waterlevel >
- Oberer Main - Elbe >
- Schenkenau >
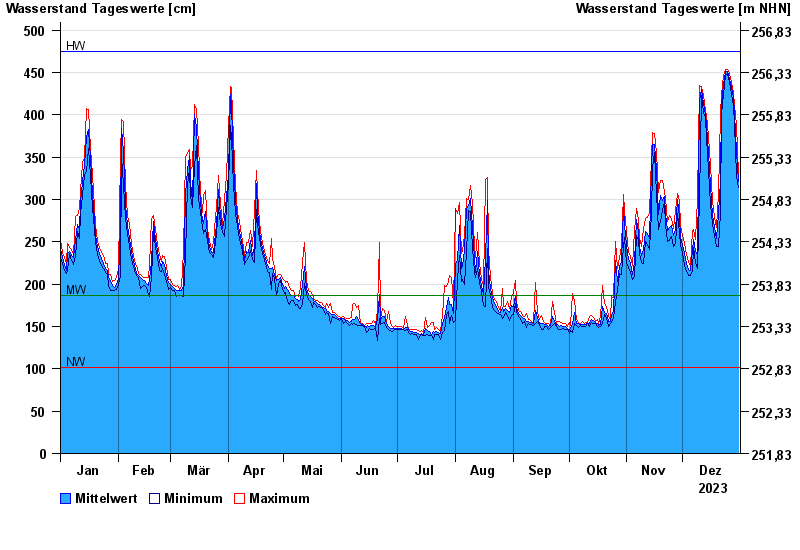
- Chart of year

Chart of year Schenkenau / Itz
Waterlevel from 01.01.2023 to 31.12.2023
| Date | Mean value [cm] | Maximum [cm] | Minimum [cm] |
|---|---|---|---|
| 31.12.2023 | 321 | 330 | 314 |
| 30.12.2023 | 357 | 389 | 327 |
| 29.12.2023 | 402 | 411 | 389 |
| 28.12.2023 | 420 | 426 | 410 |
| 27.12.2023 | 432 | 438 | 425 |
| 26.12.2023 | 443 | 449 | 438 |
| 25.12.2023 | 451 | 454 | 449 |
© Bayerisches Landesamt für Umwelt 2024