
- Start >
- Rivers >
- Waterlevel >
- Oberer Main - Elbe >
- Laufermühle >
- Chart of year

Chart of year Laufermühle / Aisch
Waterlevel from 28.02.2022 to 27.02.2023
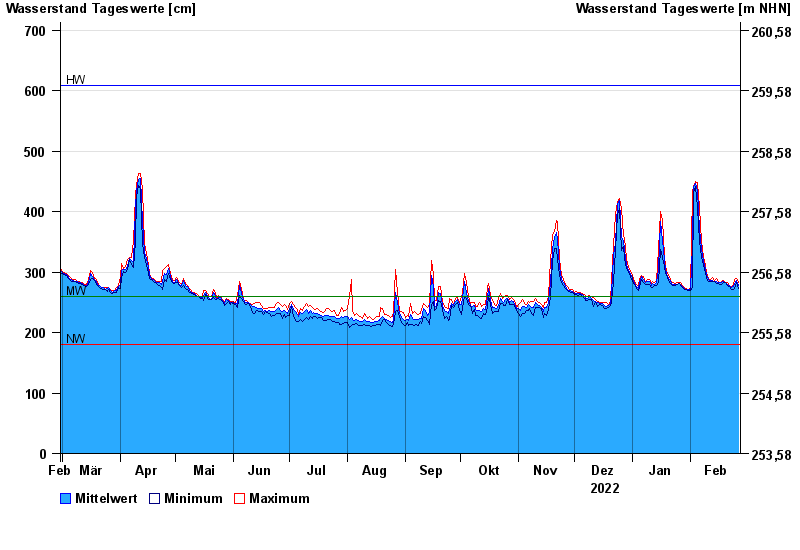
| Date | Mean value [cm] | Maximum [cm] | Minimum [cm] |
|---|---|---|---|
| 27.02.2023 | 277 | 282 | 273 |
| 26.02.2023 | 286 | 289 | 282 |
| 25.02.2023 | 281 | 288 | 273 |
| 24.02.2023 | 276 | 278 | 271 |
| 23.02.2023 | 274 | 276 | 271 |
| 22.02.2023 | 277 | 278 | 276 |
| 21.02.2023 | 280 | 282 | 277 |
© Bayerisches Landesamt für Umwelt 2024