
- Start >
- Rivers >
- Waterlevel >
- Oberer Main - Elbe >
- Laufermühle >
- Chart of year

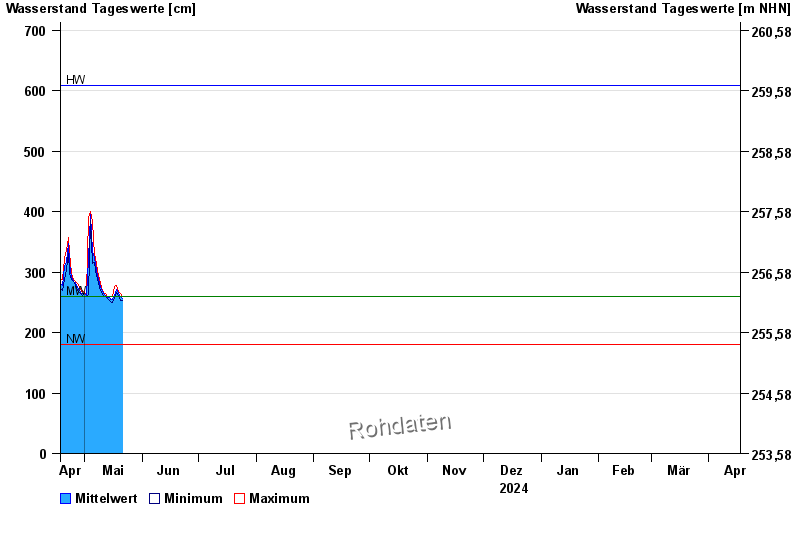
Chart of year Laufermühle / Aisch
Waterlevel from 18.04.2024 to 17.04.2025
| Date | Mean value [cm] | Maximum [cm] | Minimum [cm] |
|---|---|---|---|
| 30.04.2024 | 263 | 263 | 262 |
| 29.04.2024 | 265 | 268 | 263 |
| 28.04.2024 | 270 | 274 | 266 |
| 27.04.2024 | 275 | 281 | 269 |
| 26.04.2024 | 283 | 285 | 280 |
| 25.04.2024 | 285 | 287 | 284 |
| 24.04.2024 | 291 | 298 | 287 |
© Bayerisches Landesamt für Umwelt 2024