
- Start >
- Rivers >
- Waterlevel >
- Oberer Main - Elbe >
- Laufermühle >
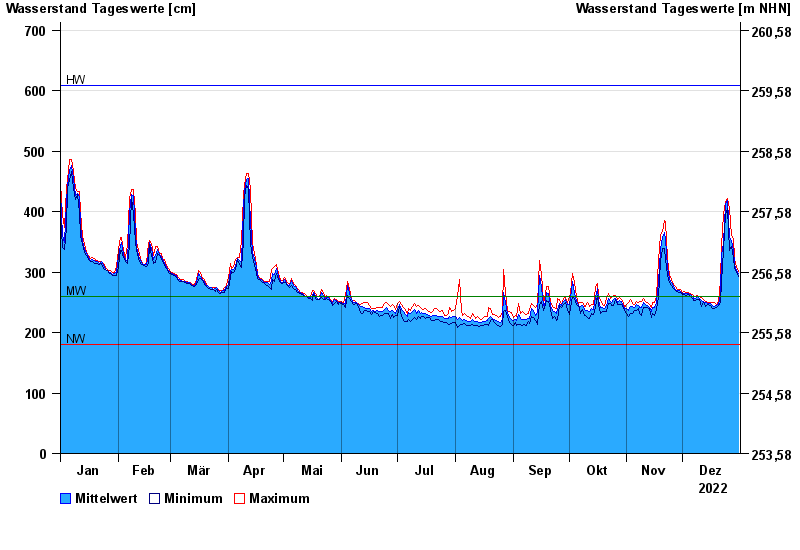
- Chart of year

Chart of year Laufermühle / Aisch
Waterlevel from 01.01.2022 to 31.12.2022
| Date | Mean value [cm] | Maximum [cm] | Minimum [cm] |
|---|---|---|---|
| 31.12.2022 | 297 | 301 | 293 |
| 30.12.2022 | 302 | 308 | 299 |
| 29.12.2022 | 312 | 323 | 306 |
| 28.12.2022 | 336 | 356 | 322 |
| 27.12.2022 | 353 | 360 | 343 |
| 26.12.2022 | 357 | 405 | 336 |
| 25.12.2022 | 418 | 421 | 405 |
© Bayerisches Landesamt für Umwelt 2024