
- Start >
- Rivers >
- Waterlevel >
- Oberer Main - Elbe >
- Langenau >
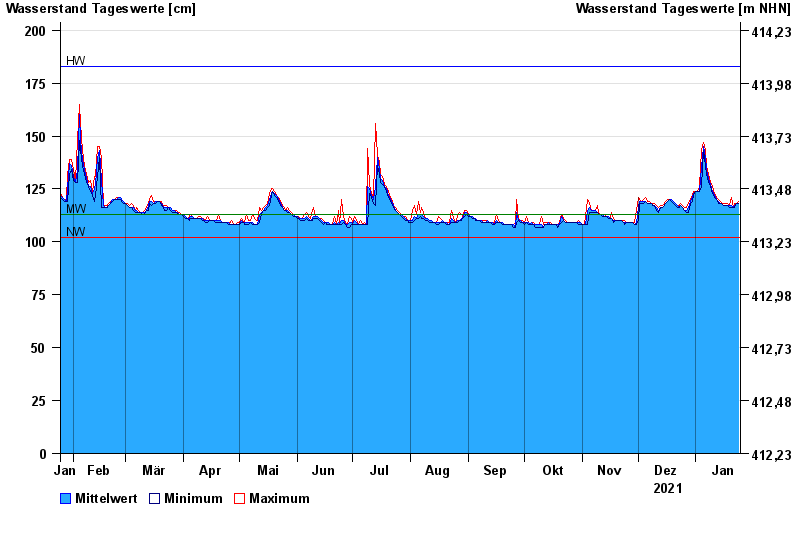
- Chart of year

Chart of year Langenau / Langenaubach
Waterlevel from 25.01.2021 to 24.01.2022
| Date | Mean value [cm] | Maximum [cm] | Minimum [cm] |
|---|---|---|---|
| 24.01.2022 | 118 | 119 | 118 |
| 23.01.2022 | 118 | 118 | 118 |
| 22.01.2022 | 117 | 118 | 116 |
| 21.01.2022 | 116 | 116 | 116 |
| 20.01.2022 | 117 | 121 | 116 |
| 19.01.2022 | 117 | 117 | 116 |
| 18.01.2022 | 117 | 118 | 117 |
© Bayerisches Landesamt für Umwelt 2024