
- Start >
- Rivers >
- Waterlevel >
- Oberer Main - Elbe >
- Langenau >
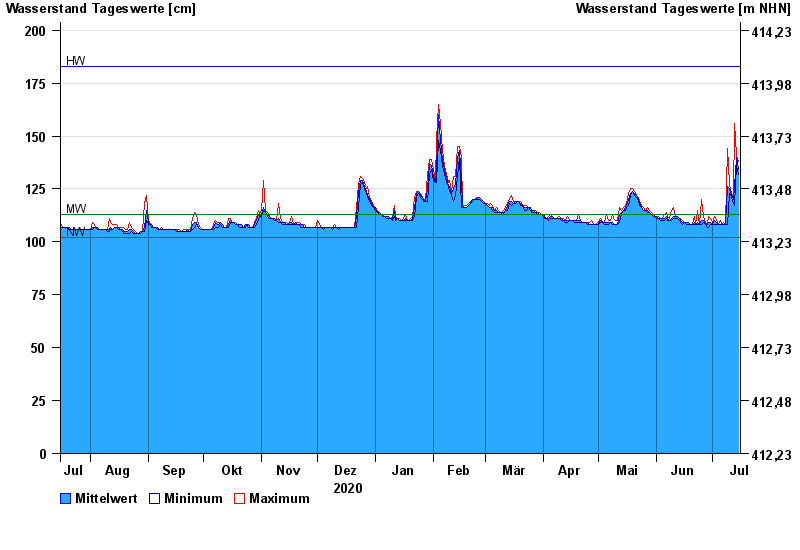
- Chart of year

Chart of year Langenau / Langenaubach
Waterlevel from 16.07.2020 to 15.07.2021
| Date | Mean value [cm] | Maximum [cm] | Minimum [cm] |
|---|---|---|---|
| 15.07.2021 | 134 | 138 | 132 |
| 14.07.2021 | 140 | 141 | 136 |
| 13.07.2021 | 126 | 156 | 117 |
| 12.07.2021 | 120 | 121 | 118 |
| 11.07.2021 | 122 | 123 | 121 |
| 10.07.2021 | 125 | 127 | 123 |
| 09.07.2021 | 126 | 144 | 108 |
© Bayerisches Landesamt für Umwelt 2024