
- Start >
- Rivers >
- Waterlevel >
- Oberer Main - Elbe >
- Hohenberg >
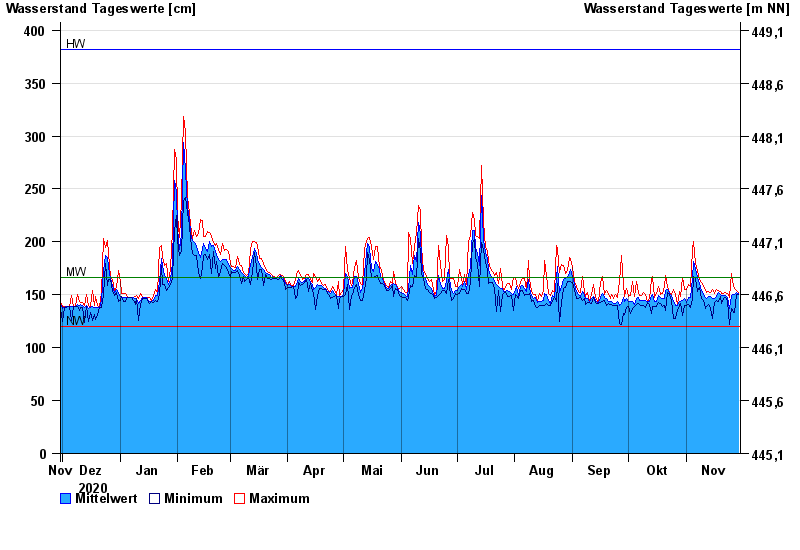
- Chart of year

Chart of year Hohenberg / Eger
Waterlevel from 30.11.2020 to 29.11.2021
| Date | Mean value [cm] | Maximum [cm] | Minimum [cm] |
|---|---|---|---|
| 29.11.2021 | 151 | 152 | 150 |
| 28.11.2021 | 152 | 154 | 150 |
| 27.11.2021 | 150 | 156 | 133 |
| 26.11.2021 | 150 | 158 | 133 |
| 25.11.2021 | 149 | 170 | 137 |
| 24.11.2021 | 137 | 147 | 122 |
| 23.11.2021 | 147 | 151 | 144 |
© Bayerisches Landesamt für Umwelt 2024