
- Start >
- Rivers >
- Waterlevel >
- Oberer Main - Elbe >
- Hohenberg >
- Chart of year

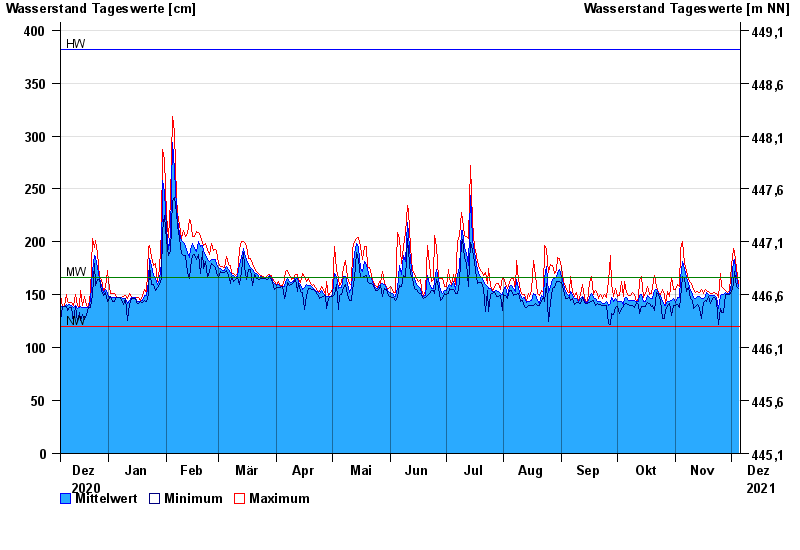
Chart of year Hohenberg / Eger
Waterlevel from 06.12.2020 to 05.12.2021
| Date | Mean value [cm] | Maximum [cm] | Minimum [cm] |
|---|---|---|---|
| 05.12.2021 | 158 | 160 | 156 |
| 04.12.2021 | 167 | 176 | 158 |
| 03.12.2021 | 183 | 190 | 172 |
| 02.12.2021 | 182 | 194 | 160 |
| 01.12.2021 | 161 | 178 | 153 |
| 30.11.2021 | 151 | 154 | 150 |
| 29.11.2021 | 151 | 152 | 150 |
© Bayerisches Landesamt für Umwelt 2024